

Chats
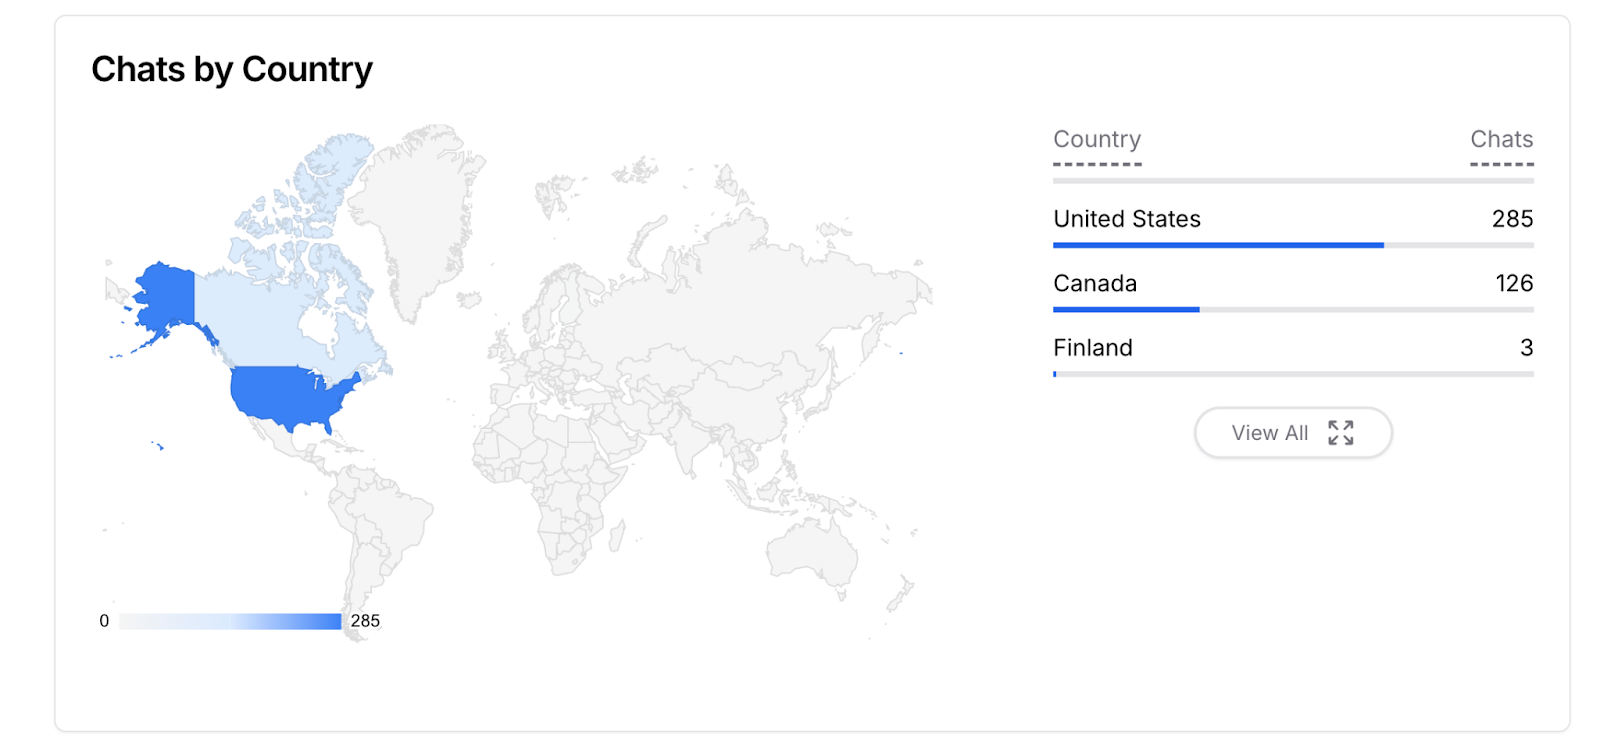
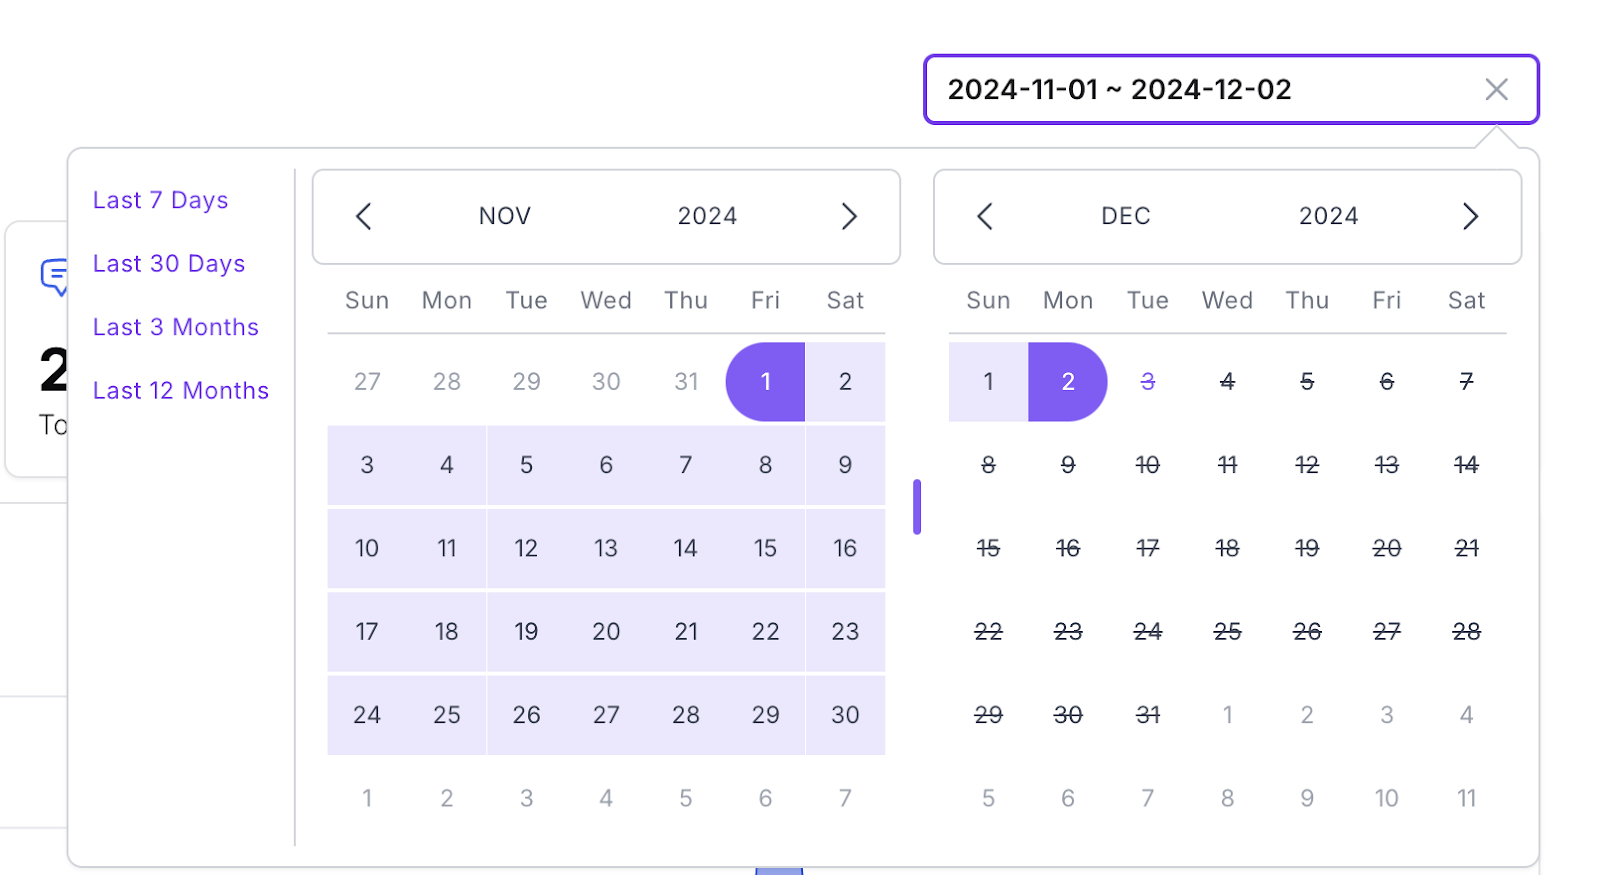
Analytics aggregates the activity of your AI agent across conversations. It has four pages: Chats, Topics, Sentiment, and Helpdesk. By default, it shows the activity for all AI Agents under your workspace for the last week.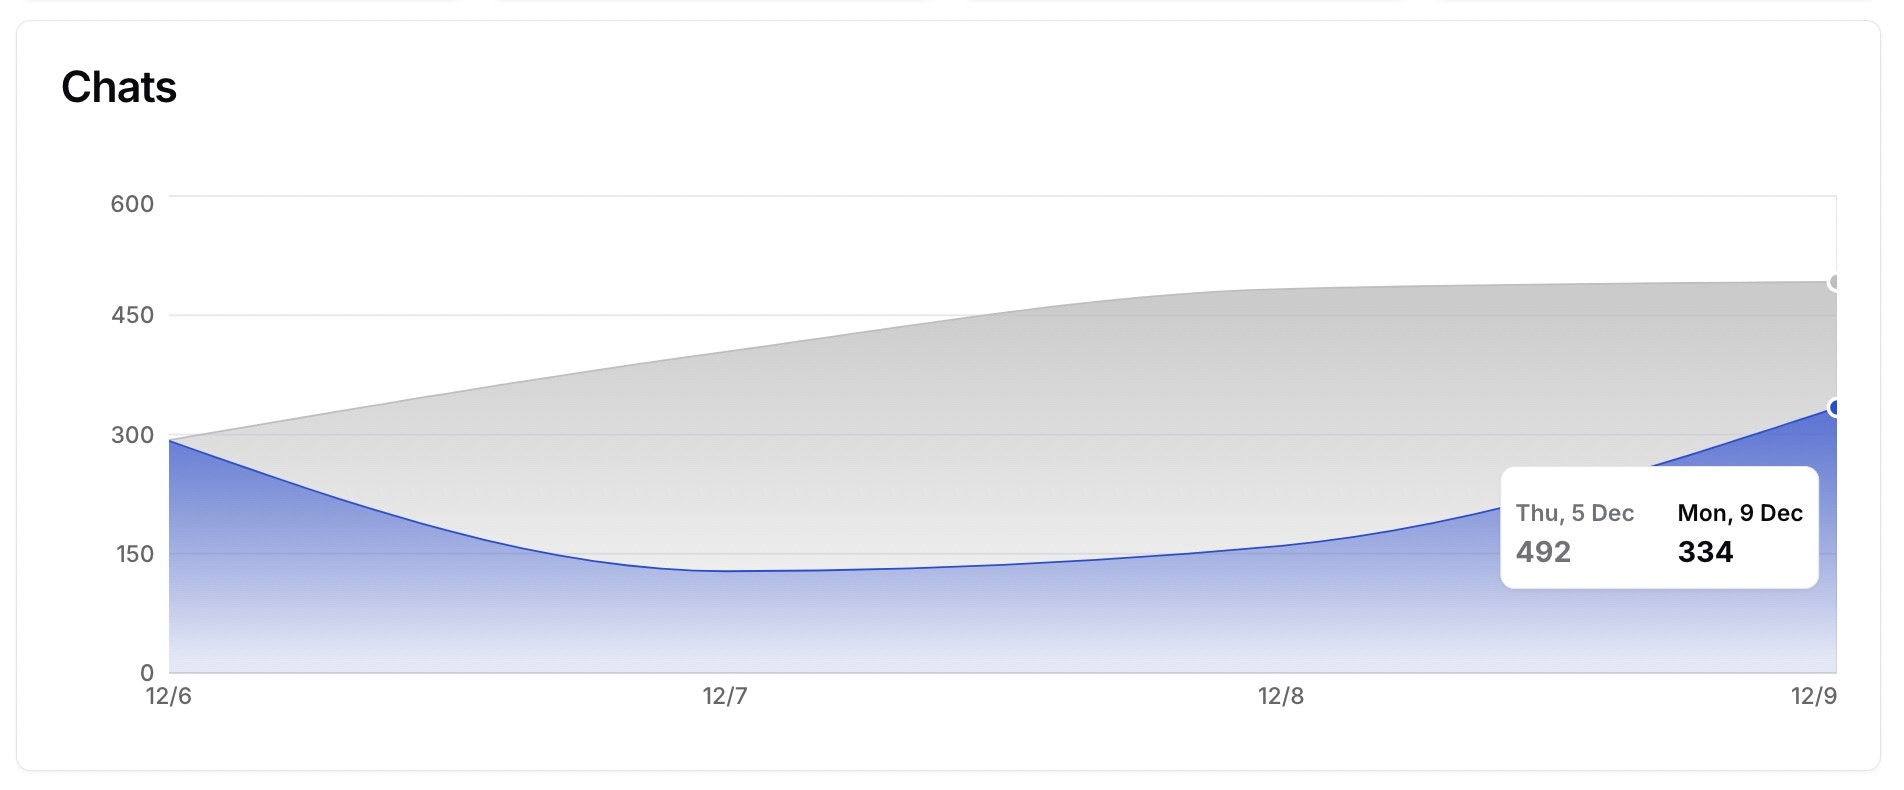
Topics
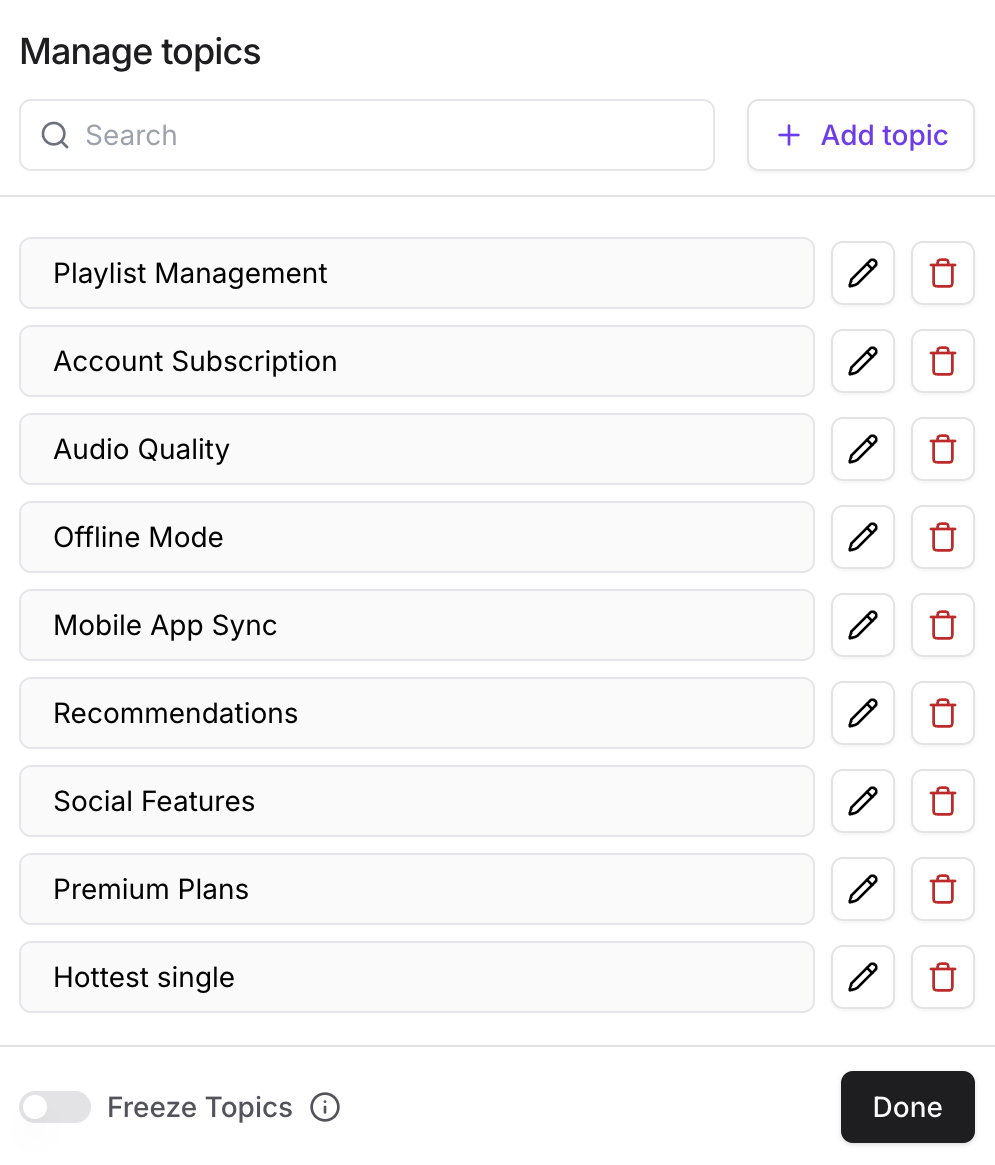
This section shows the topics that were included in the conversations and mentioned by the users.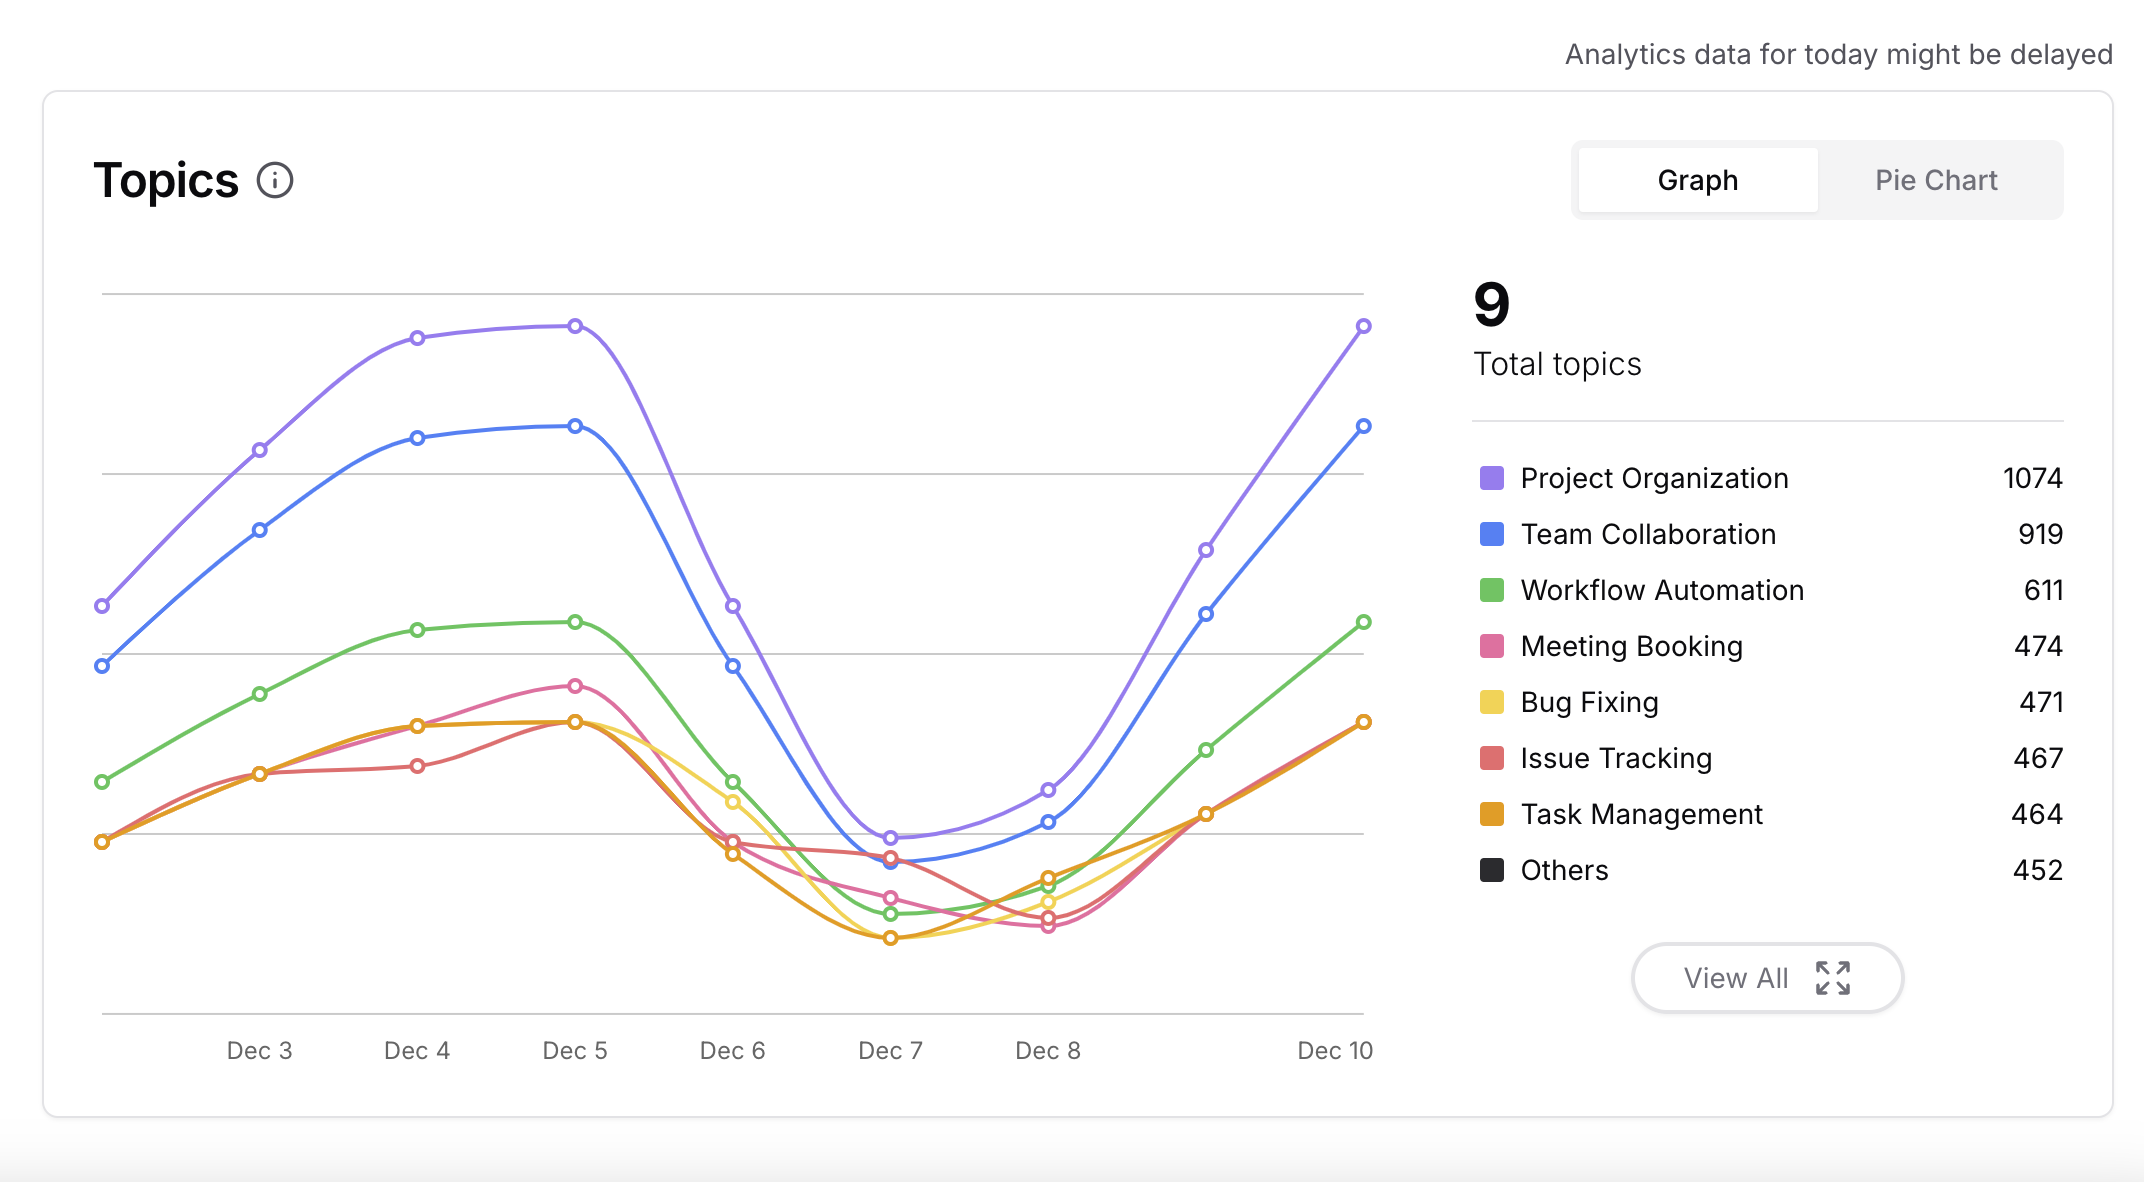
- Search topics
- Add topic
- Edit topic
- Delete topic
- Freeze topics: Stopping the AI Agent to detect any topics automatically.
Sentiment
This section shows how the AI Agent detects the sentiment and emotion of the users during the conversations. The sentiment analysis is detected automatically by the AI Agent.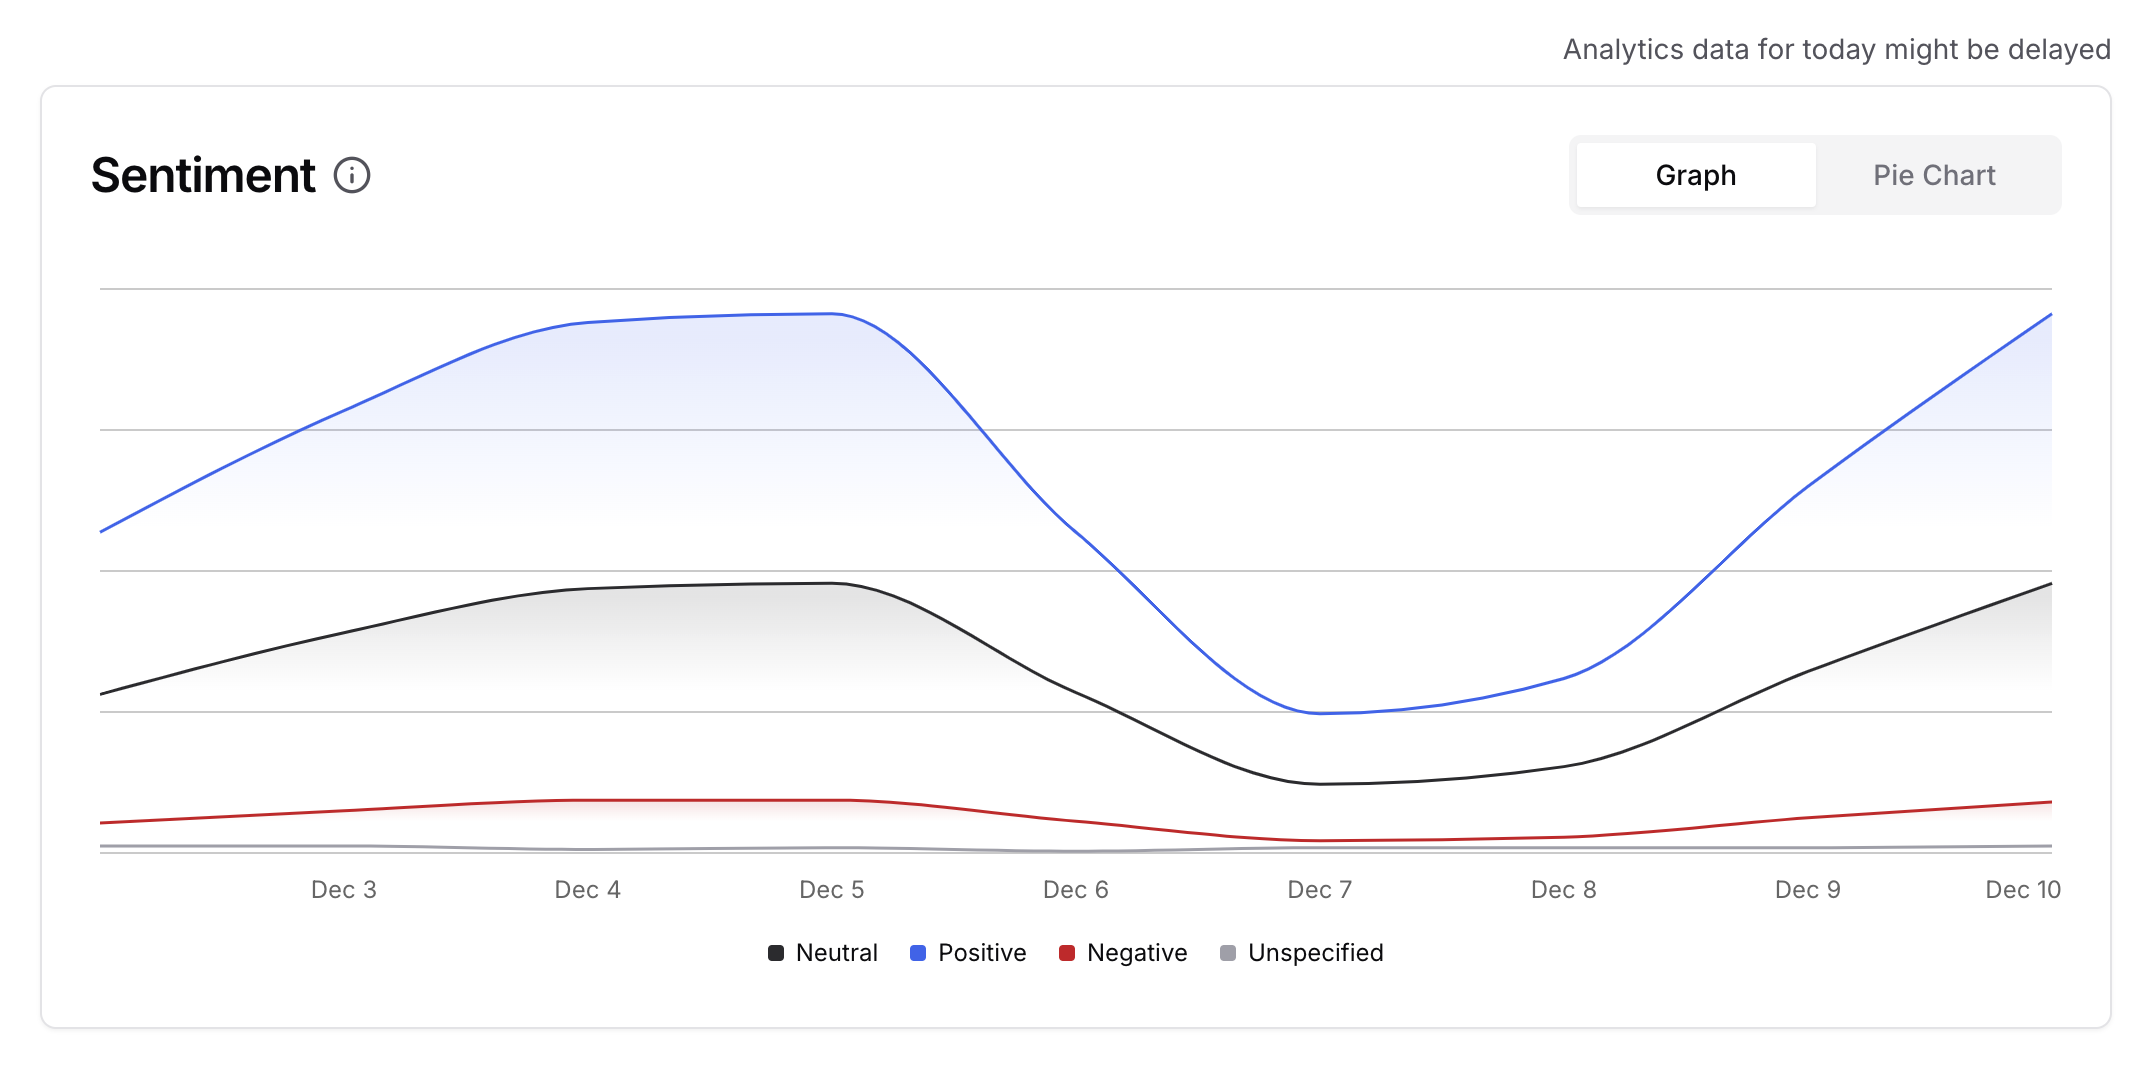
Helpdesk
Track ticket volume over time to monitor your support workload and resolution trends. Every metric on this page shows its change against the previous period, and each chart plots the Selected period as a solid line against the Previous period as a dotted one.Team member performance
The table at the top of the page breaks the period down by team member, so you can see how the workload is spread across your human agents:- Solved tickets: tickets that member marked solved.
- Tickets replied: tickets they replied to at least once.
- Replies sent: the total number of replies they sent.
- Median first response time: how long customers waited for that member’s first reply.
- Median response time: the median across all of their replies.
- Median time to close: how long their tickets stayed open before being solved.
Ticket volume
- Created tickets: tickets opened during the period.
- Solved tickets: tickets marked solved during the period.
- Unsolved tickets: the outstanding backlog, plotted on its own chart so you can see whether it is growing or shrinking.
- Agent replies sent: replies sent by human agents during the period, charted beside Unsolved tickets. Internal notes, automated messages, and AI agent replies are excluded.
Response times
- Median first response time: how long a customer waits for the first human reply.
- Median response time: the median across all replies, not just the first.
- Median time to close: how long a ticket stays open before it is solved.